You have the data. What you are not sure of is which test actually answers your question, and whether you ran it correctly.
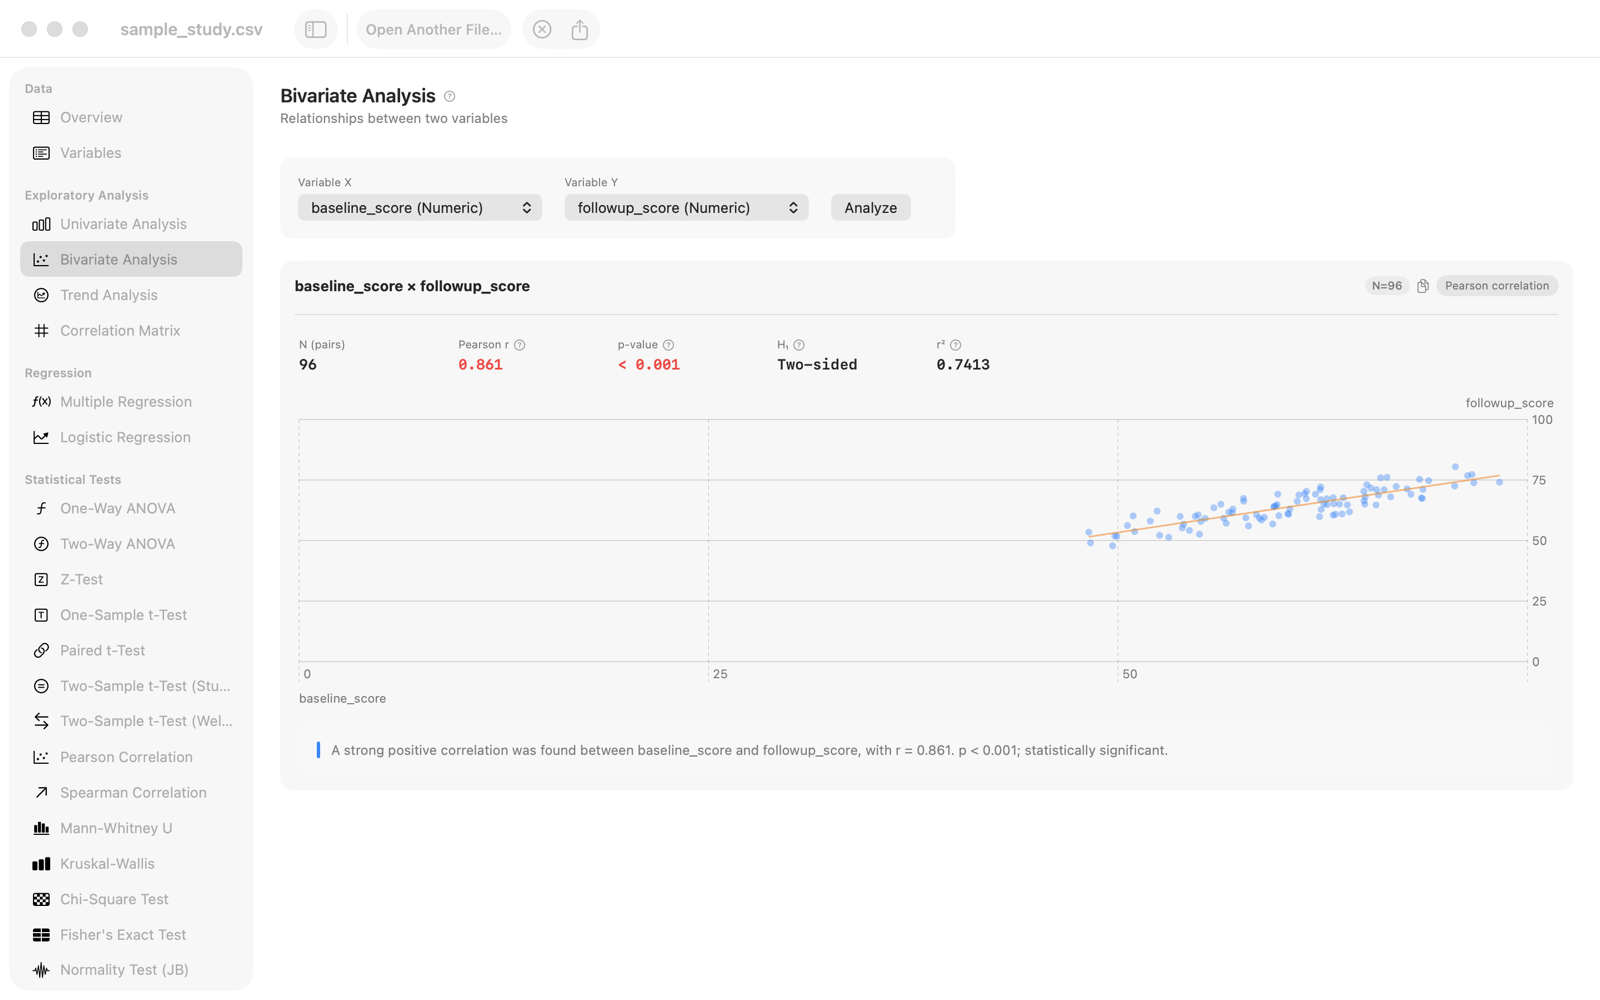
That is what Elenchus is for. Open your CSV and it reads your columns; the right test is already in the sidebar, and one click gives you the statistic, the p-value, and the effect size, ready to read and cite.
A statistical desk, not a blank spreadsheet
Elenchus is organized like a research note: inspect the data, choose the question, run the test, then keep the number that matters.
For the answer, not the setup
Running one test should not mean setting up an R environment, trusting a spreadsheet formula you cannot see, or reaching for something the size of SPSS. Those are tools for people who work in statistics all day.
Elenchus is for the person who already has the data and needs the answer. A student checking a hypothesis. A researcher writing up findings. An analyst turning data into a decision. You open the file, and the work that is left is reading the result.
What it does
See your data before you test it
Every file opens on a summary: how many rows, what is missing, which columns are numeric, categorical, or dates. You know what you are working with before you run anything.
The tests you were taught, in one place
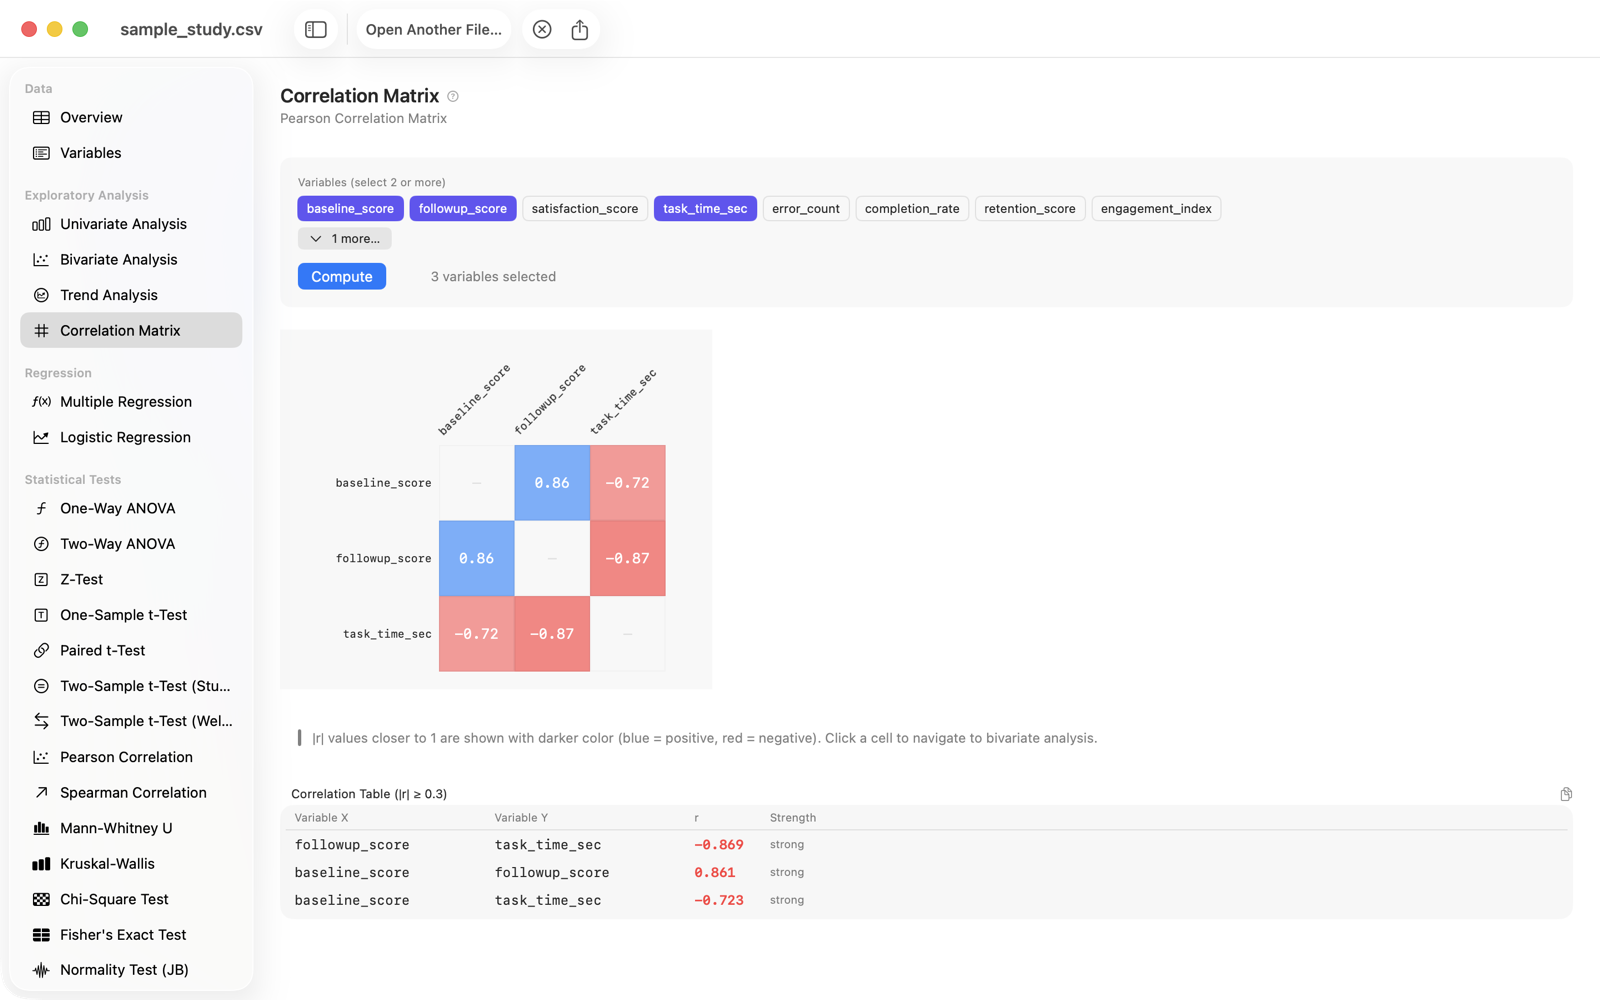
Parametric and non-parametric, from a one-sample t-test to ANOVA, Mann-Whitney, chi-square, correlation, and multiple regression. Choose the one that fits and read the result.
Read the result, not the manual
Each test returns the statistic, the p-value, and the effect size, laid out to read at a glance. You interpret the finding; Elenchus handles the arithmetic.
Written from first principles
No R runtime, no Python bridge, no library computing your statistics out of sight. Every function is written in-house and checked against known values, so the number you cite is the number that is correct.
Details
- Platform
- macOS, native
- App languages
- English, Japanese, French
- Status
- Available on the Mac App Store
Opens the App Store.